Writing Task 1 exercise 2: Number of cases of diarrhea in Mashhad between 1983 and 1992.
Writing Task 1
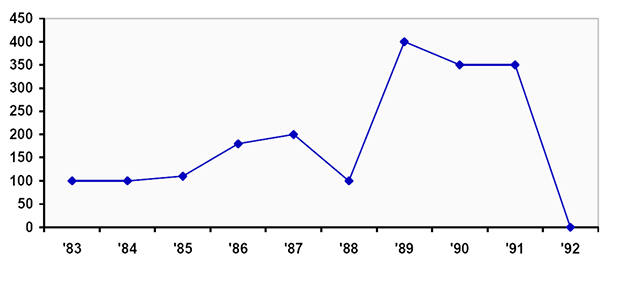
You should spend about 20 minutes on this task. The graph below gives information about the number of cases of diarrhea in Mashhad between 1983 and 1992. Summarise the information by selecting and reporting the main features, and make comparisons where relevant. Write at least 150 words.
The graph below gives information about the number of cases of diarrhea in Mashhad between 1983 and 1992.
Summarise the information by selecting and reporting the main features, and make comparisons where relevant.
Write at least 150 words.
Brand 6:
The given line graph illustrates the changes in the number of cases of diarrhea in Mashhad between 1983 and 1992.
Overall, the number of cases rose sharply to a peak in 1989 before falling dramatically to zero in 1992, after fluctuating between 1983 and 1988.
In 1983, the number of cases stood at around 100 and increased gradually to about 200 in 1987. However, the figure dropped back to 100 in 1988 before climbing sharply to a peak of around 400 in 1989.
After this peak, the figure declined slightly to approximately 350 in 1990 and remained unchanged in 1991. However, there was a dramatic drop to zero in 1992.
Brand 6 improve to Band 8:
✦ Use precise trend vocabulary
Band 8 answers often use verbs like:
Increase
- rose to
- climbed to a peak of
- surge
Decrease
- declined to
- drop
- fall sharply
Stability
- remain stable
- level off
Make the overview slightly more analytical
Highlight the major trend + peak + final drop more smoothly.
Improve flow with complex sentence structures
Band 9 writing often uses subordinate clauses and smoother linking.
◆ Avoid repeating the same words
Many candidates repeat cases too often.
Use variation:
- the number of cases
- the figure
- the total
- cases
✦ Use better sentence structure
Instead of many short sentences, combine ideas:
Band 6 style
The number increased in 1987. It dropped in 1988.
Band 8 style
The number increased in 1987 before dropping again in 1988.
Final brand 8 version
The line graph illustrates the number of reported diarrhea cases in Mashhad over the period from 1983 to 1992.
Overall, the number of cases fluctuated during the first half of the period before rising sharply to a peak in 1989. After this point, the figure declined slightly and then fell dramatically to zero by the end of the period.
In 1983, approximately 100 cases were recorded, and this figure increased steadily to around 200 in 1987. However, the number then dropped back to about 100 in 1988. This decline was followed by a sharp surge, with cases reaching a peak of roughly 400 in 1989.
After peaking, the figure fell slightly to approximately 350 in 1990 and remained stable in 1991. In the final year, however, the number of cases plunged dramatically to zero in 1992.
Example Band others 8 style answer
The line graph illustrates the number of reported cases of diarrhea in Mashhad over a ten-year period from 1983 to 1992.
Overall, the number of cases fluctuated considerably during the period. After a gradual rise in the mid-1980s, cases peaked dramatically in 1989 before falling sharply to zero by 1992.
In 1983 and 1984, the number of cases remained stable at around 100. This figure increased slightly to about 110 in 1985 and then rose more noticeably to approximately 180 in 1986. The upward trend continued in 1987, when the number reached around 200 cases.
However, the figure dropped back to about 100 in 1988. A dramatic increase occurred in the following year, with cases surging to a peak of roughly 400 in 1989. After this peak, the number declined slightly to around 350 in both 1990 and 1991 before falling sharply to zero in 1992.